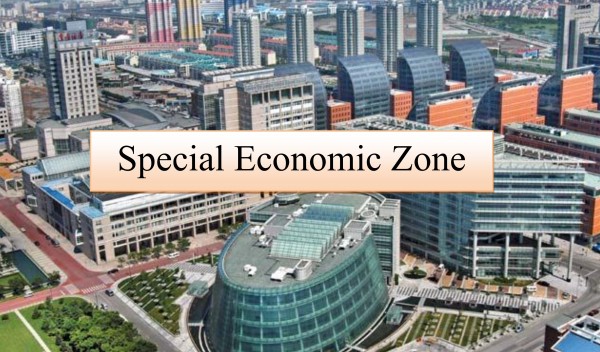
A policy was introduced in the EXIM Policy effective from 1.4.2000 for setting up of Special Economic Zones in the country with a view to provide an internationally competitive and hassle free environment for exports. Units may be set up in SEZ for manufacture of goods and rendering of services. All the import/export operations of the SEZ units will be on self certification basis. The units in the Zone have to be a net foreign exchange earner but they shall not be subjected to any pre-determined value addition or minimum export performance requirements. Sales in the Domestic Tariff Area by SEZ units shall be subject to payment of full Custom Duty and import policy in force. Further Offshore banking units may be set up in the SEZs.
Eligibility for Export/Trading/Star Trading/Super Star Trading Houses
F.O.B. Criteria
Category of Houses |
Average FOB value of exports during the preceding 3 licensing years, in rupees |
FOB value of eligible export during preceding licensing year in rupees |
| Export House | Rs. 15 crores | Rs. 22 crores |
| Trading House | Rs. 75 crores | Rs. 112 crores |
| Star Trading House | Rs. 375 crores | Rs. 560 crores |
| Super star Trading House | Rs. 1125 crores | Rs. 1680 crores |
Net Foreign Exchange Earnings
Category of Houses |
Average net foreign exchange value during the preceding 3 licensing years, in rupees |
Net foreign exchange value of exports made during preceding licensing year in rupees |
| Export House | Rs. 12 crores | Rs 18 crores |
| Trading House | Rs. 62 crores | Rs. 90 crores |
| Star Trading House | Rs. 312 crores | Rs. 450 crores |
| Super star Trading House | Rs. 937 crores | Rs. 1350 crores |
- Import Facilities
- Marketing Development Assistance
- Foreign Currency, Accounts
- Foreign Exchange Facilities
- Golden Status Certificate
- Other facilities as specified in the policy
Export Houses Status for Export of Services
Category |
Average free foreign exchange earning during the preceding three licensing years in rupees |
Free Foreign exchange earning during the preceding licensing year in rupees |
Average NFE earned made during the preceding licensing year in rupees |
NFE earned during the preceding licensing year in rupees |
Service Export House |
4 crores | 6 crores | 3 crores | 5 crores |
International Service Export House |
20 crores | 30 crores | 15 crores | 25 crores |
International Star Service Export House |
100 crores | 150 crores | 75 crores | 125 crores |
International Super Star Service Export House |
300 crores | 450 crores | 225 crores | 375 crores |
Export Processing Zone /Export Oriented Units
- To earn foreign exchange
- To generate employment opportunities
- To facilitates transfer of technology by foreign investment and other means
- To contribute to the overall development of the economy
Course contents of export import
Introduction
- Welcome and Introduction
- What is Business?
- What is Export and Import?
- Benefit of Export
- Exporter and Importer and their types
- Introduction Foreign Trade Policy
- IEC RCMC GST
- Selection of product
- Selection of market
- How to select product for Export
- Market research
- Market selection
- Exporter profile & Certificates
- Role of Trade Promotion Organization
- Registration cum Membership Certificate
Government bodies
- DGFT – Director General of Foreign Trade
- Ministry of Commerce
- CBEC – Central Board of Excise and Customs
- GST Goods and Services Tax
- MSME – Micro, Small & Medium Enterprises
- Chamber of Commerce GCCI
- Export Promotion Councils (EPC)
- Commodity Boards
- Development Authorities
- Trade Associations
- Export Inspection Agencies
- Indian Embassy – Role & Departments
- Status Holder Certificate
- FIEO – Federation of Indian Export Organisations
International Bodies
- International Chamber of Commerce
- World Trade Organization (WTO)
- International trade council (ITC)
International Marketing
- What is Marketing
- What is International marketing
- Why you?
- How to Identify Potential Buyers
- Where to find Buyer
- Export Import Statistics
- Market Entry Strategy & Marketing Mix
- How to find Buyers
- Ways of Finding Buyer
- Sources of finding buyers
- Offline Marketing
- Importance of Trade Fairs & Exhibition
- How to do Personal visit
- How to appoint Agent
- Sources to Build Genuine Data Base of Buyers
- Foreign Buyers Contacts list
- Foreign Importer Directories
- How to get Buyer’s Data,
- Digital Marketing
- What is Online Marketing?
- How to use Google
- What is SEO
- Social Media Websites
- Facebook LinkedIn YouTube
- How to create Effective Videos
- Google AdWords (Only pay for results)
- IMP websites
- B2B Sites Registration and Free Listing
- Promotion- sales, advertising, PR.
- Email Marketing & Tools
- Classified Website
- B2B and B2C Concept
- Email Marketing
- Communication
- Approach Effectively To Overseas Buyer
- Communicate with Buyers professional way
- Reaching the Right Person
- Language Problem with Solution
INCOTERMS
- Delivery Terms in Export – Import Business
- IncoTerms 2010 made by ICC
- EXW FOB CFR CIF CPT DAP DDP
Shipping & Logistics Management
- Multi Modal Transportation
- Types of Shipping Line / Airlines / Forwarder
- Transhipments / Partial Shipments
- Types of Containers
- Types of Vessels / Ships
- CHA – Custom House Agent (Role & Responsibilities)
- Freight Forwarder’s (Role & Responsibilities)
- EDI Registration
- Freight Calculation – FCL / LCL
- Packing
- Procedure of Export Clearance
- Shipping Bill Filing
- Custom Clearance Procedure
- Method of Quotation, Sampling & Negotiation
Documentation
- Pre & post shipment Procedure and Documentation
- Pre-Shipment Procedure and Documentation
- Post-Shipment Procedure and Documentation
- Documents Practical
- Pre shipment Documentation
- Post Shipment Documentation
- AD Code – Authorized Dealer Code
- Preparation of Proforma Invoice
- Commercial Invoice
- Packing List
- Certificate of Origin COO
- Certificate of Inspection
- Certificate of Insurance
- Certificate of Inspection
- GSP (Generalized System of Preferences)
- Health/ Veterinary/ Sanitary Certification
- Fumigation Certificate
- Shipping Bill
- Airway Bill
- Bill of Lading
- Bill of Exchange / Sight Draft
- e-BRC Certificate
- EP Copy
Payment Methods in Export Import
- Various Types of Payment Terms
- Documents Against Payment D/P
- Documents Against Acceptance D/A
- Letter of Credit C. Payment
- Risk Involved in Various Payment Terms
- Introduction to Letter of Credit – UCPDC
Banking and Risk Management
- RBI – Reserve Bank of India
- Bank Role in Foreign Trade
- Letter of Credit (L.C.) with crucial knowledge
- Type of L.C.
- Export Import Finance
- Pre Shipment Finance
- Post Shipment Finance
- Difference Between CC / PCFC
- EEFC Account
- Suppliers Credit & Buyer’s Credit
- Understanding Risk in International Market
Risk Management
- Product Risk
- Foreign Exchange Risk
- ECGC i.e. Export Credit Guarantee Corporation
- Confirm Letter of Credit L.C.
Import procedure & documentation
- Opportunities in Import
- Import Cycle
- Import Duty Calculator
- Documents for Import
- Preparation of Bill of Entry
- Custom Bonded Warehouse
- Bond & Ex-Bond Bill of Entry
- Container Detention Charges
- Import Cargo Tracking
- Arrangement of Import Delivery Order
- Cargo Examination & Delivery
- Factory & Dock De-Stuffing
- Billing for Import Consignments
- Import on Re-Export Basis
- High Sea Sale
- Third Country Export
- Anti-Dumping Duty
- IGM
Govt. Schemes & Benefits
- MEIS – Merchandise Exports from India Scheme
- Service Export from India Scheme (SEIS)
- Duty DrawBack DBK
- Free Trade Agreement
- Advance Authorization Scheme
- EPCG – Export Promotion Capital Goods
- Special Economic Zones (SEZs)
- Export-oriented Units (EOUs)
- Software Technology Parks (STPs)
- Electronics Hardware Technology Parks (EHTPs)
- Biotechnology Parks (BTPs)
Business Cycle
Revision and Q&A
Eligibility
- Who want to learn and Do Export and Import Business can join us.
- Businessman, Entrepreneurs, and Industrialist.
- Documents:Valid Photo ID Aadhar Card / Passport / Pan Card
Registration Procedure
- Fill up the Application Form on Website or send your detail by Email or what’s app with photo id.
- For Fees Contact us
- Fee Can Paid by Bank Deposit / through Net Banking/Paytm /Cash in Person at our Head office Ahmedabad
- Pay fees and confirm your registration with office for Training
- Limited seats so register as early as possible and meet the international Trainer
- We are arranging this Four Day training in all over the India and Wold
- Become our partner in your city for more detail contact us +91 9737313573
Additional Services
- Personal Exim consultancy On Your Product
- Get Export Import Licence (IEC)
- Digital Signature for DGFT, Class 2 and Class 3
- Get RCMC Certificate For Government benefits
- APEDA FIEO EEPC Certificate
- MSME / Udhyog Adhar SSI Certificate
- Export import Consultancy
- Export Import Trade Delegation & Tour
- Data of Exporter Importer Buyer (Genuine List)
- Export Import Agent
- Get SEO Friendly Website for your Company
- MEIS SEIS Benefits
- EPCG Advance Authorisation
- Port/ICD/Air Cargo visit as per approval
- ISO Certificate
Letters of Credit
Main types of LC
Top Cannabis Oils Exports by Country
Sometimes called hash oil, cannabis oil is a concentrated form of the cannabis plant typically consumed by smoking, vaporizing, eating or absorption through the skin. Besides recreation, cannabis is used to help relieve pain, anxiety and nausea among a growing number of other medicinal applications subject to scientific testing. Innovative uses for cannabis oils include beauty and skin care goods, beverages, chocolates and even cannabis dog treats according to TheStreet writer Steve Fiorillo.
Among continents, Asian countries accounted for the highest dollar worth of exported cannabis oils during 2017 with shipments valued at $1.2 billion or 51% of the global total. In second place were European exporters at 26.6% while 12.5% of worldwide cannabis oils shipments originated from North America. Smaller percentages came from Africa (3.9%) trailed by the Mideast (2.4%), Latin America (2.2%) excluding Mexico then Oceania (0.5%).
The 6-digit Harmonized Tariff System code prefix is 130219 for cannabis oils, extracts and tinctures.
Top Cannabis Oils Exports by Country
- Top 15
- Advantages
- Opportunities
- Companies
- China: US$791.2 million (32.4% of exported cannabis oils)
- India: $254.4 million (10.4%)
- United States: $228.5 million (9.4%)
- Germany: $212 million (8.7%)
- Spain: $145.1 million (5.9%)
- Italy: $80.6 million (3.3%)
- Switzerland: $73.2 million (3%)
- South Korea: $59 million (2.4%)
- Mexico: $46.4 million (1.9%)
- Netherlands: $43.9 million (1.8%)
- Ireland: $43.4 million (1.8%)
- Madagascar: $39.4 million (1.6%)
- Vietnam: $37.7 million (1.5%)
- Belgium: $32.4 million (1.3%)
- Canada: $30.4 million (1.2%)
Among the top exporters, the fastest-growing cannabis oils exporters since 2013 were: Madagascar (up 446.8%), Vietnam (up 367.5%), Netherlands (up 71.3%) and Belgium (up 67.3%).
Three countries posted declines in their export sales of cannabis oils: Italy (down -29%), India (down -0.2%) and Switzerland (down -0.2%).
Searchable List of Cannabis Oils Exporters
See also Drugs and Medicine Exports by Country, Heart Pacemaker Export Sales by Country and Cannabis Oils Imports by Country
Research Sources:
Cision, Companies That Stand to Benefit From Record Growth in CBD Market (press release). Accessed on October 14, 2018
Investopedia, Net Exports Definition. Accessed on October 14, 2018
The Motley Fool, The 10 Largest Marijuana Stocks by Sean Williams. Accessed on October 14, 2018
The Street, 5 Cannabis Products on the Rise in 2018 by Steve Fiorillo. Accessed on October 14, 2018
The World Factbook, Field Listing: Exports – Commodities, Central Intelligence Agency. Accessed on October 14, 2018
Trade Map, International Trade Centre. Accessed on October 14, 2018
Top Soft Drinks Exporters by Country
Global sales from top soft drinks exporters in 2017 totaled US$19.8 billion.
Overall, the value of soft drinks exports rose by an average 7.5% for all exporting countries since 2013 when soft drinks shipments were valued at $18.4 billion. Growth in the global value of exported soft drinks gained 5.6% from 2016 to 2017.
From a continental perspective, European countries generated the highest international sales of soft drinks during 2017 with shipments valued at $13.2 billion or 66.9% of the global total. In second place were Asian exporters at 18.5% while 9.1% of worldwide soft drinks exports originated from North America. Smaller percentages came from Latin America excluding Mexico but including the Caribbean (2.4%), Africa (1.5%) and Oceania notably New Zealand and Australia (0.7%).
The four-digit Harmonized Tariff System code prefix is 2202 for soft drinks. That code prefix encompasses waters (including mineral and aerated waters) containing added sugar or other sweeteners as well as non-alcoholic beer and other non-alcoholic beverages.
Top Soft Drinks Exporters by Country
- Countries
- Advantages
- Opportunities
- Companies
- Austria: US$2.7 billion (13.9% of total soft drinks exports)
- Switzerland: $1.84 billion (9.3%)
- Germany: $1.81 billion (9%)
- Netherlands: $1.7 billion (8.6%)
- Thailand: $1.3 billion (7%)
- United States: $1.2 billion (6.3%)
- Belgium: $840.3 million (4.2%)
- France: $780.1 million (3.9%)
- United Kingdom: $553 million (2.8%)
- Italy: $513.5 million (2.6%)
- Poland: $397.5 million (2%)
- South Korea: $388.6 million (2%)
- Denmark: $371 million (1.9%)
- Mexico: $370.6 million (1.9%)
- Malaysia: $325.6 million (1.6%)
Among the top exporters, the fastest-growing soft drinks exporters since 2013 were: Thailand (up 64.6%), Italy (up 49.1%), Poland (up 32.1%) and Mexico (up 31.5%).
Four countries incurred declines in their exported soft drinks sales namely Belgium (down -12.6%), France (down -11.3%), United Kingdom (down -6.4%) and Malaysia (down -2.9%).
Interactive meetings calendar 2019 WTO
Interactive meetings calendar 2019
NEW YEAR’S DAY (WTO non-working day)
WTO Non-Working Day
GOOD FRIDAY (WTO non-working day)
EASTER MONDAY (WTO non-working day)
Committee on Subsidies and Countervailing Measures – Special Meeting followed by Regular Committee
10:00
Informal Open-ended Committee on Agriculture – Special Session
10:00
Registration opens for delayed broadcast of arbitration hearing in US-EU aircraft dispute
14:30
Committee on Budget, Finance and Administration
15:00
Committee on Subsidies and Countervailing Measures – Regular meeting
PM
ASCENSION DAY (WTO non-working day)
WTO Non-Working Day
WHIT MONDAY (WTO non-working day)
Committee on Agriculture
10:00
Services Meeting
10:00
JEUNE GENEVOIS (WTO non-working day)
WTO Non-Working Day
WTO Public Forum
09:00
WTO Public Forum
08:30
WTO Public Forum
08:30
WTO Public Forum
08:30
Services Meeting
10:00
Services Meeting
10:00
Services Meeting
10:00
Expanding Trade Across The Maghreb
5 facts about jobs and economic transformation in IDA countries
The study uncovers many findings, some familiar, some new. These will be featured in more detail in future blogs. Meanwhile, here are five important facts drawn from this extensive research, which combines data from over 16,000 episodes of real GDP growth, labor supply information for over 140 countries, and firm-level analysis from Jobs Diagnostics.
1. Economic growth doesn’t always bring enough good jobs.
Our analysis of growth episodes shows that growth in real GDP is no guarantee of an increase in employment in all cases. The relationship between real GDP and employment growth is positive across growth episodes on average, but the spread of employment with GDP growth is wide. Analysis of per capita growth episodes globally suggests that changes in the working-age population, labor force participation, and employment rate explain only about 20% of GDP per capita growth: 80% is explained by growth in labor productivity.
2. Underemployment, not unemployment, is the main challenge.
In many LICs, the problem is not the quantity of jobs but their quality. Most people in LICs work because they cannot afford not to. Employment rates are high. But people in LICs work irregular hours in low-quality, low-productivity jobs. Many are underemployed. On average, in low- and middle-income countries 40% of employed workers work fewer than 35 hours per week. Around a third of employed people work over 45 hours a week, indicating that their hourly productivity is low, so they need to work long hours to survive. Low-income countries with rapidly growing youthful populations need more better jobs, not simply more of the same types of jobs. That requires growth with economic transformation into higher productivity work.
3. Structural transformation drives productivity growth.
The main source of better jobs in LICs is the movement of underemployed agricultural labor into services and industry. Our growth analysis suggests that almost 80% of labor productivity growth in low-income countries comes from the reallocation of labor from lower-productivity agriculture into relatively higher-productivity services and industry. However, overall labor productivity growth within sectors tends to be low because the underdeveloped `modern’ sector of the economy is often unable to absorb the workers released from agriculture into higher-productivity, capital rich, waged jobs.
4. Structural transformation starts with productivity gains in agriculture and is linked to urbanization.
Raising agricultural productivity in LICs and LMICs is critical to catalyze growth and economic transformation. When agricultural productivity is growing, under-employed labor moves out of agriculture and GDP grows faster. The opposite is also true. When agricultural productivity is falling, labor is moving into agriculture: family members stay on the farm, which reduces agricultural productivity and lowers economic growth.
Urbanization, especially in secondary cities, happens with sectoral transformation in low- and lower middle-income countries. The migration of surplus labor from farms to towns and cities raises agricultural productivity and provides a pool of labor in urban centers. In low-income countries, it seems to happen first in the towns within reach of rural people, or on the periphery of the capital: the growth in the share of the urban population in secondary towns and cities is double that of the primary city. In low-income countries that are urbanizing faster than average, labor reallocation from agriculture adds four times as much to per capita income growth as it does in countries with slower than average urbanization.
5. Wage work matters.
A big increase in the share of wage jobs (both formal and informal) seems to coincide with the transformation from low income to middle income status. The richer a country is, the higher the share of waged employment in total employment. For countries with annual per capita income below $600, this share is only about 20%, but it reaches 63% of employment in middle-income countries. The shares of agricultural workers, unpaid family workers, and self-employed workers decline in richer countries. This suggests that the creation of waged employment may be an important aspect of the economic transformation that countries make as they progress toward higher per capita income. This is one of our most significant findings, supporting the conclusion of the 2013 World Development Report that there are important developmental gains from waged jobs (even when they are informal), because they are better than the own-account jobs they tend to replace. We are now investigating this aspect in countries where there is sufficiently long time-series data, and sufficient economic progress from lower middle-income status.
These five facts suggest that pathways to better jobs are linked to economic transformations that reduce economic inactivity and underemployment and reallocate labor from less productive unpaid or self-employed to more productive waged jobs. Low-income countries are too often characterized by the lag in those transformations and a lag between the transformation in GDP and transformations in jobs, and the price is paid by households and workers who remain trapped in low-productivity activities with meager livelihoods. This new publication coupled with new guidance for country Jobs Diagnostics, brings insights for policy makers seeking to identify the specific constraints holding back positive jobs transformations and hindering labor mobility in their country. We believe that the World Bank’s twin goals —ending extreme poverty and boosting shared prosperity— will be achieved faster when the low-income countries design effective interventions to support faster transformations toward higher-productivity jobs and improved livelihoods. Under IDA19, these countries need well financed jobs and growth strategies, and jobs focused IFC investments and lending operations that bring smoother pathways to better jobs within reach of poor people.


