World trade will continue to face strong headwinds in 2019 and 2020 after growing more slowly than expected in 2018 due to rising trade tensions and increased economic uncertainty. WTO economists expect merchandise trade volume growth to fall to 2.6% in 2019 — down from 3.0% in 2018. Trade growth could then rebound to 3.0% in 2020; however, this is dependent on an easing of trade tensions.
WTO Director-General Roberto Azevêdo said: “With trade tensions running high, no one should be surprised by this outlook. Trade cannot play its full role in driving growth when we see such high levels of uncertainty. It is increasingly urgent that we resolve tensions and focus on charting a positive path forward for global trade which responds to the real challenges in today’s economy – such as the technological revolution and the imperative of creating jobs and boosting development. WTO members are working to do this and are discussing ways to strengthen and safeguard the trading system. This is vital. If we forget the fundamental importance of the rules-based trading system we would risk weakening it, which would be an historic mistake with repercussions for jobs, growth and stability around the world.”
Trade growth in 2018 was weighed down by several factors, including new tariffs and retaliatory measures affecting widely-traded goods, weaker global economic growth, volatility in financial markets and tighter monetary conditions in developed countries, among others. Consensus estimates have world GDP growth slowing from 2.9% in 2018 to 2.6% in both 2019 and 2020.
The above-average trade growth of 4.6% in 2017 suggested that trade could recover some of its earlier dynamism, but this has not materialized. Trade only grew slightly faster than output in 2018, and this relative weakness is expected to extend into at least 2019 (Chart 1). This is partly explained by slower growth in the European Union, which has a larger share in world trade than in world GDP.
Chart 1: World merchandise trade volume and real GDP growth, 2011-2020
Annual % change
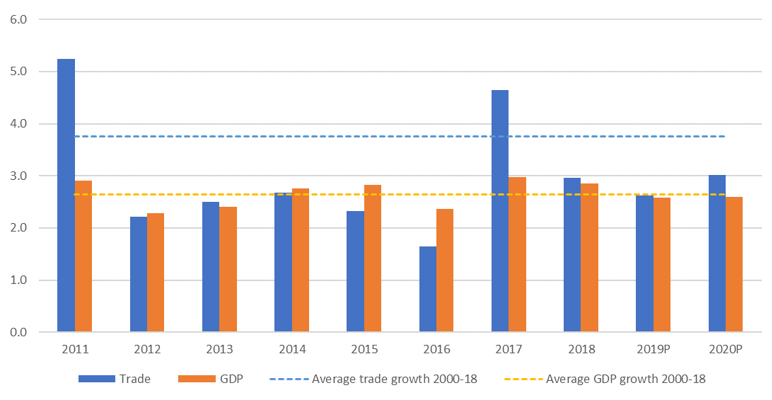 Note: GDP is measured at market exchange rates. Data for 2019 and 2020 are projections.
Source: WTO and UNCTAD for trade, consensus estimates for GDP.
The preliminary estimate of 3.0% for world trade growth in 2018 is below the WTO’s most recent forecast of 3.9% issued last September. The shortfall is mostly explained by a worse-than-expected result in the fourth quarter, when world trade as measured by the average of exports and imports declined by 0.3%. Until then, third quarter trade had been up 3.8%, in line with WTO projections.
In recognition of the high degree of uncertainty associated with trade forecasts under current conditions, Chart 2 uses shaded bands to illustrate a range of possible trade outcomes in 2019. Trade expansion in the current year is most likely to fall within a range from 1.3% to 4.0%. It should be noted that trade growth could be below this range if trade tensions continue to build, or above it if they start to ease.
Chart 2: Volume of world merchandise trade, 2015Q1-2019Q4
Seasonally-adjusted volume index, 2005=100
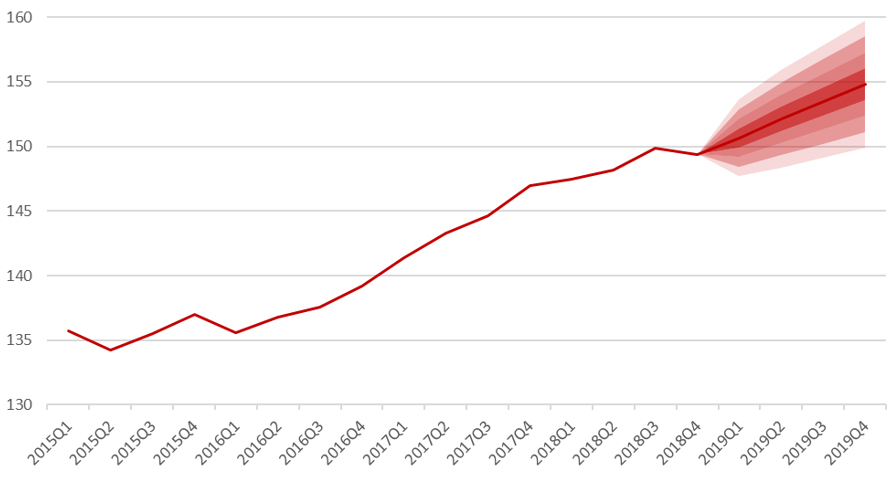 Source: WTO and UNCTAD, WTO Secretariat estimates.
Nominal trade values also rose in 2018 due to a combination of volume and price changes. World merchandise exports totalled US$ 19.48 trillion, up 10% from the previous year. The rise was driven partly by higher oil prices, which increased by roughly 20% between 2017 and 2018 (Chart 3). The value of commercial services trade rose nearly as much, with exports totalling US$ 5.80 trillion in 2018, up 8% from the previous year. Detailed breakdowns of merchandise and commercial services trade by country and region are shown in Appendix Tables 1 through 4 and Appendix Chart 1. Trade statistics in value terms are highly sensitive to fluctuations in prices and exchange rates and as a result should be interpreted with caution.
Chart 3: Prices of primary commodities, Jan. 2014 – Feb. 2019
Indices, January 2014=100
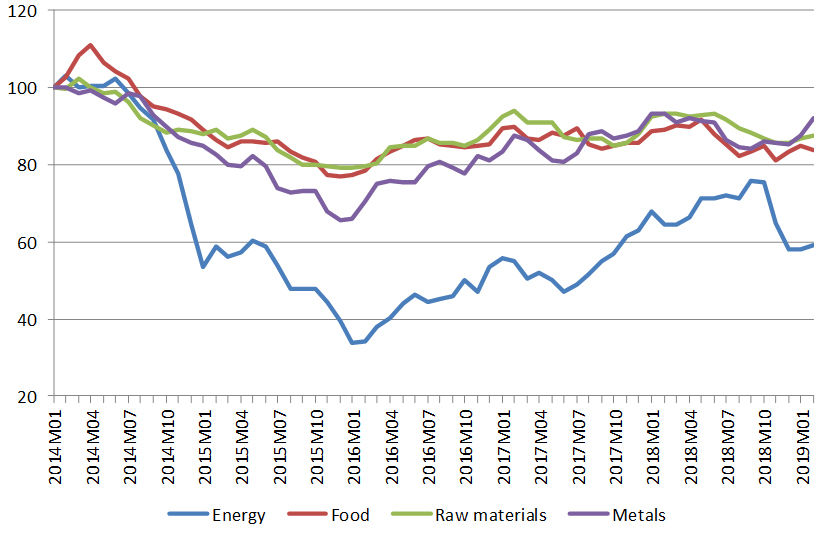 Source: IMF Commodity Price Statistics.
There were few changes in export and import rankings among major traders in terms of US dollar values. The fastest merchandise export growth in nominal terms was recorded by oil producers, including the Kingdom of Saudi Arabia (34.8%) and the Russian Federation (25.6%). Merchandise import values increased most for Indonesia (20.2%), Brazil (19.8%), China (15.8%) and Viet Nam (15.4%). Among commercial services traders, China registered strong increases in the value of its exports (17%) and imports (12%). India also recorded double digit growth in commercial services trade on both the export side (11%) and the import side (14%).
The current trade forecast reflects downgraded GDP projections for North America, Europe and Asia, mostly due to macroeconomic considerations including the diminishing effect of expansionary fiscal policy in the United States, the phase -out of monetary stimulus in the euro area and the ongoing economic rebalancing of the Chinese economy away from manufacturing and investment and toward services and consumption. Monetary authorities have put further rate hikes on hold in response to soft economic data but changes in monetary policy take some time to be felt. Trade measures announced in the past year are also reflected in underlying GDP assumptions but any additional ratcheting up of trade tensions is not factored in.
The impact of trade tensions on actual trade flows is difficult to quantify since it depends on the nature of any proposed measures and whether they are implemented or only threatened. Threatened measures can still have real effects by increasing uncertainty and discouraging investment.
WTO economists have attempted to quantify the medium-run economic impact of a wider trade conflict in which international cooperation on tariffs breaks down completely and all countries set tariffs unilaterally (Bekkers and Teh, forthcoming). Under this study, such a “worst case” scenario would lead to a reduction in world GDP in 2022 of about 2% and a reduction in global trade of about 17% compared to baseline projections. For comparison, global GDP fell about 2% and global trade dropped about 12% in 2009 following the financial crisis.
Other risks to the trade outlook are more difficult to quantify. For example, the effects of Brexit will depend on the nature of any agreement that might be reached between the United Kingdom and the European Union, with impacts mostly confined to these economies. Lower investment in the U.K. is likely in most foreseeable Brexit scenarios, which would tend to reduce productive capacity over time (Appendix Chart 2).
Details on trade developments in 2018
The slowdown in merchandise trade volume growth in 2018 was broad based, reflecting weaker import demand in both developed and developing countries, although some regions were more strongly affected than others.
Chart 4 shows seasonally-adjusted quarterly merchandise exports and imports by level of development. Weakness was most evident in the fourth quarter of 2018, when export volumes declined by 0.1% and import volumes dropped 0.5%. On the export side, the slowdown was mostly due to reduced shipments from developed countries, which contracted year-on-year in three out of the four quarters of 2018. On the import side, developed countries recorded slow growth throughout the year, particularly in the first half. Meanwhile, developing economies saw imports fall sharply (-2.1%) in the final quarter despite stronger growth earlier in the year.
Chart 4: World merchandise exports and imports by level of development, 2012Q1-2018Q4
Volume index, 2012Q1=100
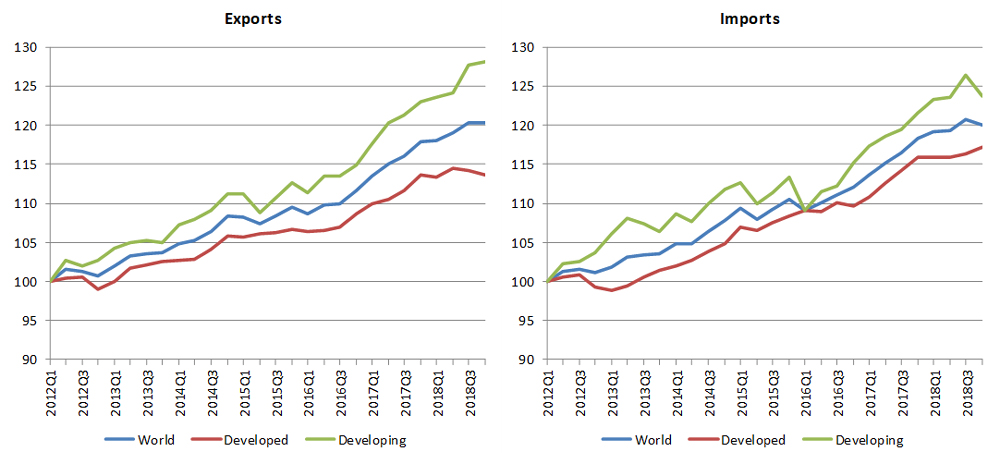 Source: WTO and UNCTAD.
Chart 5 shows merchandise export and import volumes by region. The deceleration of trade in 2018 was driven primarily by Europe and Asia due to their large share in world imports (37% and 35%, respectively). After recording strong increases in 2017, Asia saw its trade growth moderate in 2018. Meanwhile, Europe’s exports stagnated throughout the year while its imports declined gradually.
Chart 5: Merchandise exports and imports by region, 2012Q1-2018Q4
Volume index, 2012Q1=100
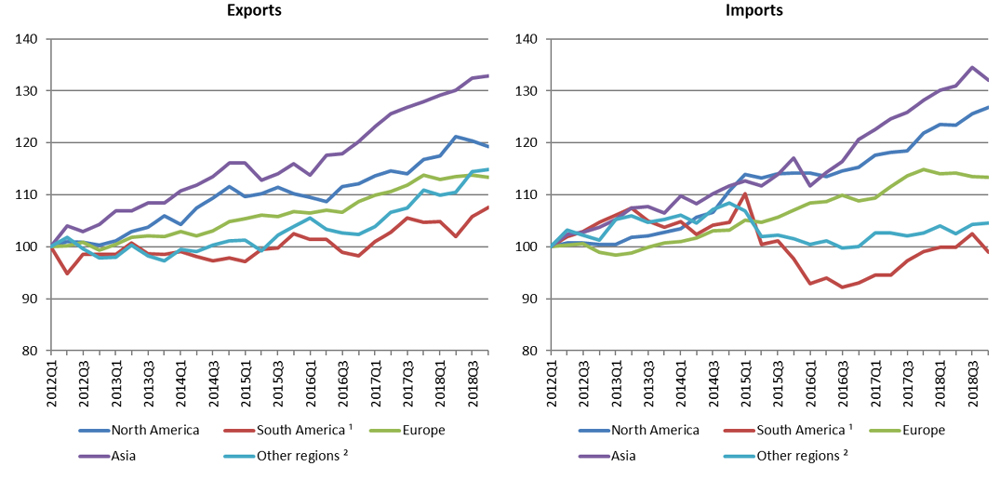 1 Refers to South and Central America and the Caribbean
2 Other regions comprise Africa, Middle East and the Commonwealth of Independent States, including associate and former member States.
Source: WTO and UNCTAD.
A major exception to the trend was North America, where a buoyant US economy contributed to strong import growth of 5.0% in 2018 (Table 1). “Other regions”, encompassing Africa, the Middle East and Commonwealth of Independent States saw export growth accelerate to 2.7%. South America’s trade flows have continued to recover gradually but have been buffeted by weaker external demand and domestic economic shocks.
Heightened trade tensions cannot explain all of the trade slowdown in 2018 but they undoubtedly played a significant role as consumers and firms anticipated new trade measures taking effect. Trade and output were also influenced by temporary shocks, including the federal government shutdown in the United States and production problems in the automotive sector in Germany toward the end of the year. These shocks are more likely to have transitory effects, causing consumers and businesses to postpone purchases and production decisions rather than cancelling them outright.
World commercial services trade recorded strong growth in 2018 for the second consecutive year. This is illustrated by Chart 6, which shows growth in the dollar value of services exports by major categories. Goods related services registered the strongest expansion, with an 10.6% increase in current dollar terms. The weakest growth was in transport, which rose by 7.1%. Commercial services overall grew 7.7% in 2018.
Chart 6: Growth in the value of commercial services exports by category, 2014-18
% change in US$ values
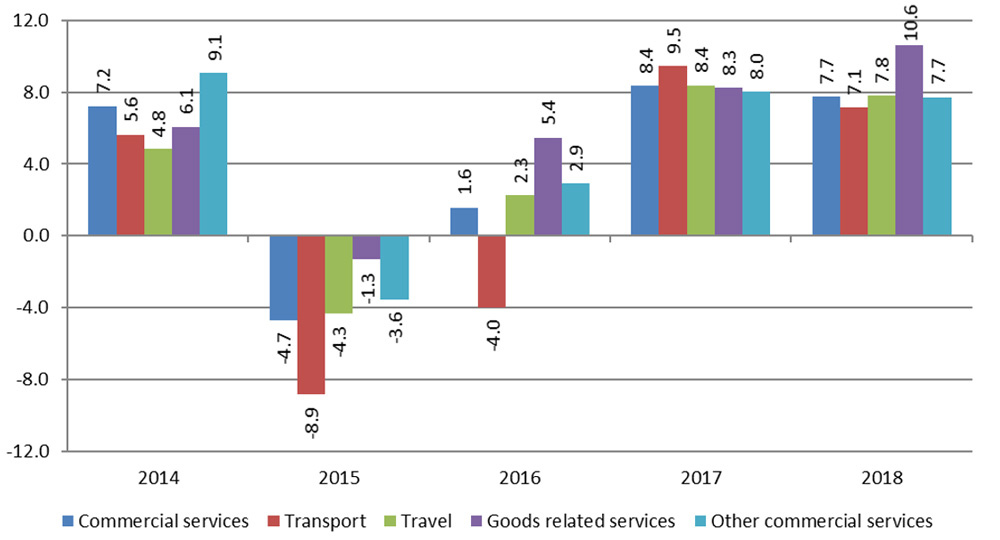 Source: WTO, UNCTAD and ITC.
Outlook for trade in 2019 and 2020
Forward-looking trade indicators have turned negative in recent months, including the WTO’s World Trade Outlook Indicator (WTOI). In February the WTOI index fell to 96.3, below its baseline value of 100, signalling slowing trade growth into the first quarter of 2019. Air freight shipments also started the year on a soft note, with international freight tonne kilometres (FTKs) down 3.0% year-on-year in January, according to statistics from the International Air Transport Association (IATA). A measure of global export orders derived from purchasing managers’ indices has also fallen to 49.1 in February, below the threshold value of 50 separating expansion from contraction (Chart 7). Taken together, these data point to continued trade weakness in the first half of 2019.
Chart 7: Global PMI new export orders index, Jan. 2010 – Feb. 2019
Index, base=50
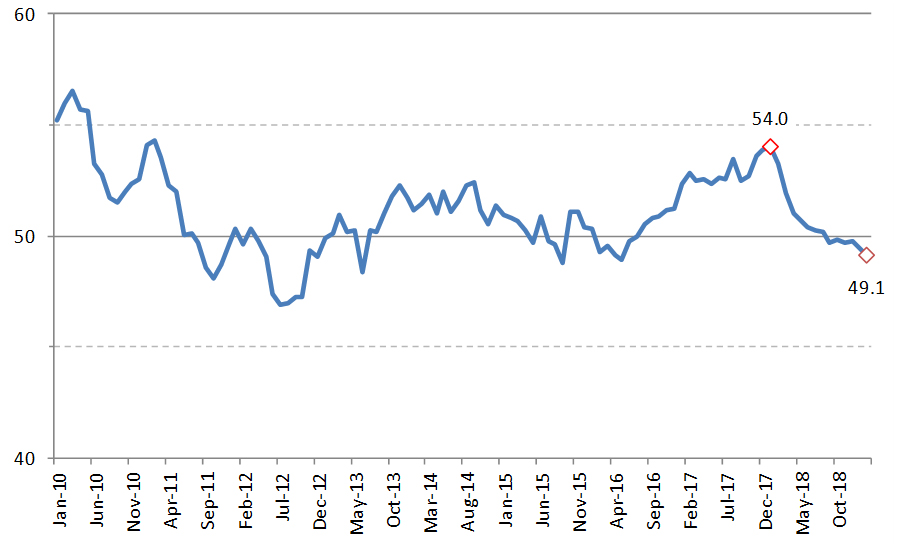 Note: Values greater than 50 indicate expansion while values less than 50 denote contraction.
Source: IHS Markit.
An index of economic policy uncertainty based on the frequency of phrases related to uncertainty in press accounts is shown in Chart 8. The index has risen consistently over time, peaking at 341 in December 2018, coinciding with the US government shutdown and US trade negotiations with China. To the extent that economic uncertainty deters investment, it can have a negative impact on trade since capital goods tend to have high import content. Conversely, a lowering of trade tensions would be expected to stimulate both investment and trade.
Chart 8: Global economic policy uncertainty, Jan. 2005 – Feb. 2019
(index, average 1997-2015=100)
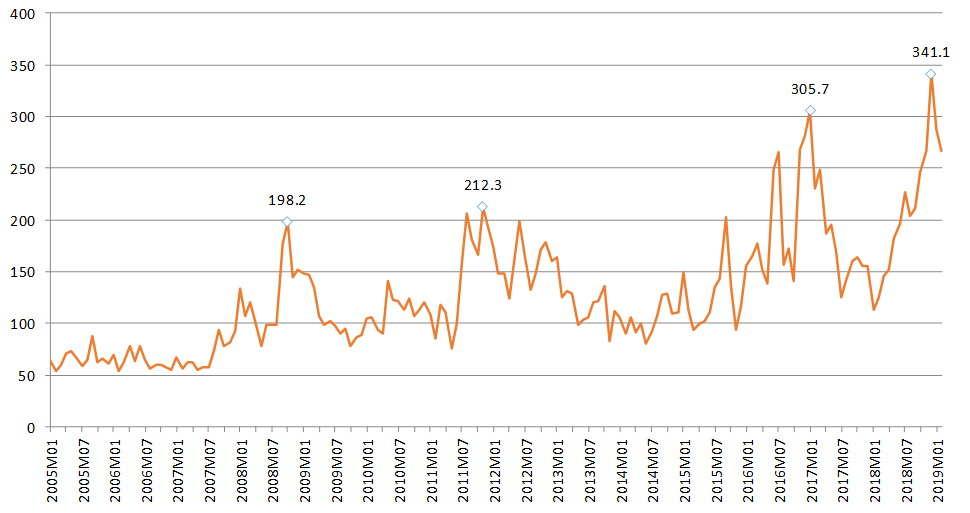 Source: PolicyUncertainty.com.
If current GDP forecasts are realised, the WTO expects the volume of world merchandise trade to grow by 2.6% in 2019, with stronger expansion in developing economies (3.4% for exports, 3.6% for imports) than in developed ones (2.1% for exports, 1.9% for imports). World trade growth should pick up slightly in 2020 to 3.0%, with growth in developing economies (3.7% for exports, 3.9% for imports) again outpacing developed countries (2.5% for exports, 1.9% for imports) (Table 1). Most risks remain firmly on the downside, with upside potential hinging on a relaxation of trade tensions.
Table 1: Merchandise trade volume and real GDP, 2015 – 2020 1
Annual % change
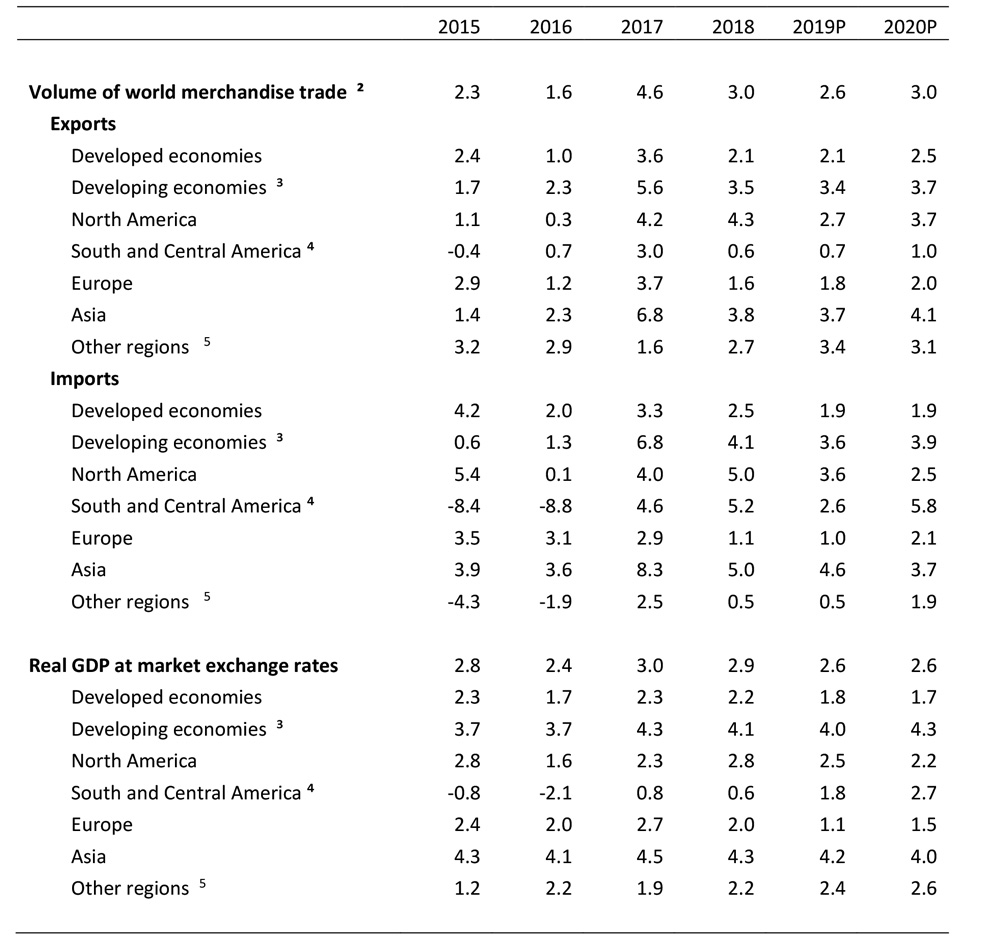 1 Figures for 2019 and 2020 are projections.
2 Average of exports and imports.
3 Includes the Commonwealth of Independent States (CIS), including associate and former member States.
4 Refers to South and Central America and the Caribbean.
5 Other regions comprise Africa, Middle East and Commonwealth of Independent States (CIS).
Source: WTO and UNCTAD for trade, consensus estimates for GDP.
Appendix Tables and Charts
Appendix Table 1: Leading merchandise exporters and importers, 2018
$bn and %
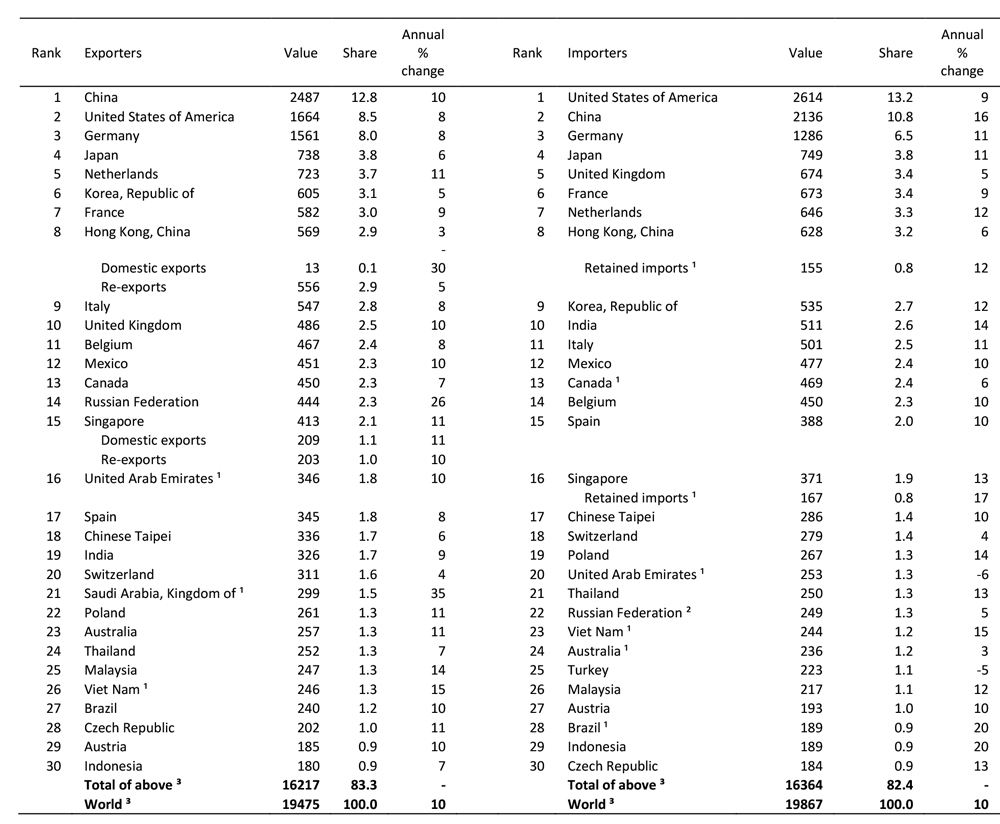 1 Secretariat estimates.
2 Imports are valued f.o.b.
3 Includes significant re-exports or imports for re-export.
Source: WTO and UNCTAD
Appendix Table 2: Leading merchandise exporters and importers excluding intra-EU (28), 2018
$bn and %
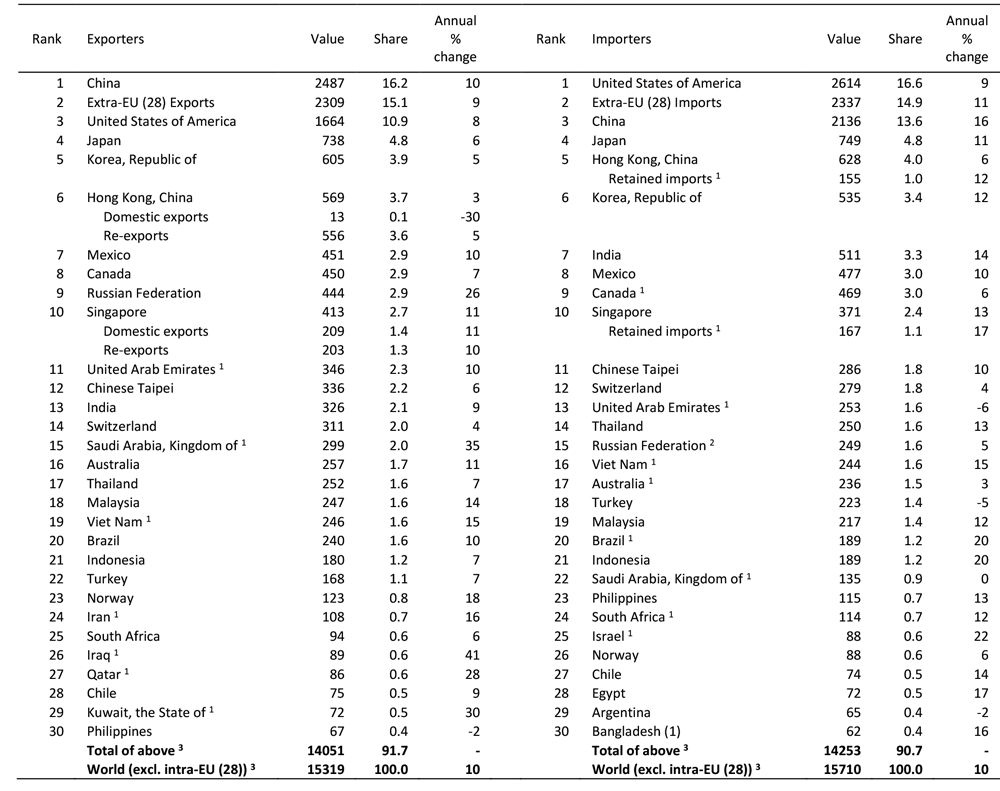 1 Secretariat estimates.
2 Imports are valued f.o.b.
3 Includes significant re-exports or imports for re-export.
Source: WTO and UNCTAD.
Appendix Table 3: Leading exporters and importers of commercial services, 2018
$bn and %
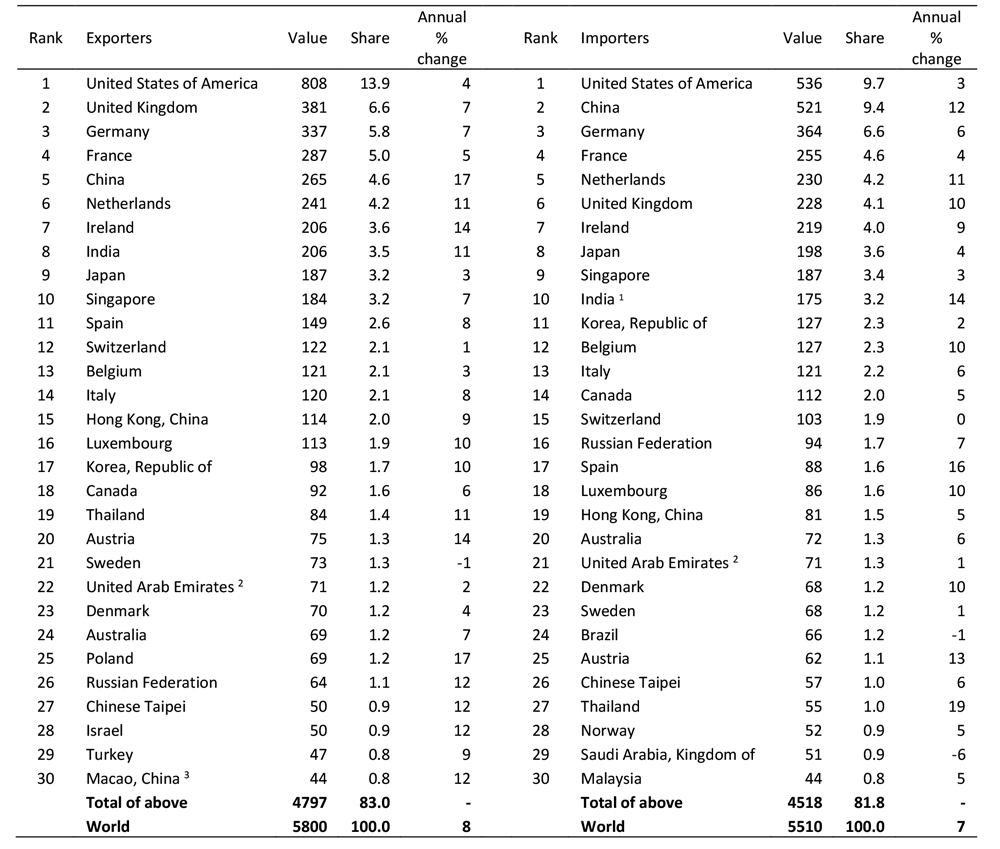 1 Imports adjusted to f.o.b. valuation.
2 Preliminary annual estimates. Quarterly data not available.
3 Follows BPM5 services classification.
– Indicates non-applicable.
Note: Preliminary estimates based on quarterly statistics. Figures for a number of countries and territories have been estimated by the Secretariat. More data available at http://data.wto.org/.
Source: WTO, UNCTAD and ITC.
Appendix Table 4: Leading exporters and importers of commercial services excluding intra-EU(28) trade, 2018
$bn and %
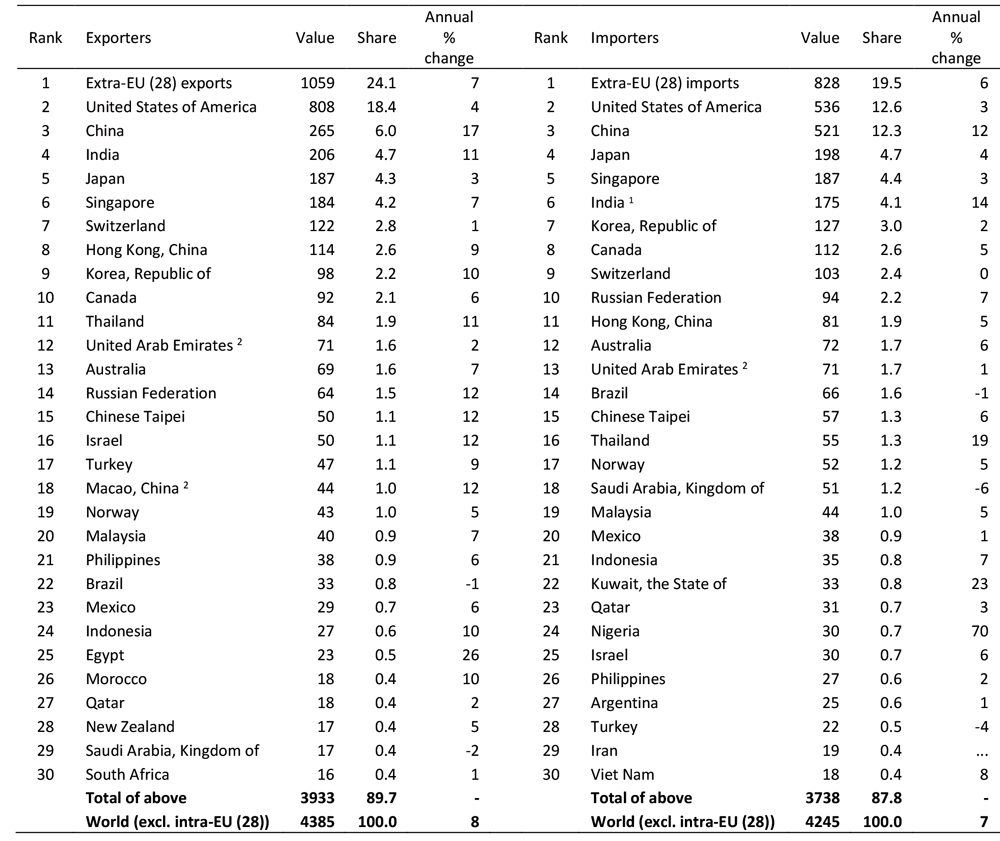 1 Imports adjusted to f.o.b valuation.
2 Preliminary annual estimates. Quarterly data not available.
3 Follows BPM5 services classification.
… indicates unavailable or non-comparable figures.
– indicates non-applicable.
Note: Preliminary estimates based on quarterly statistics. Figures for a number of countries and territories have been estimated by the Secretariat. More data available at http://data.wto.org/.
Source: WTO, UNCTAD and ITC.
Appendix Chart 1: Merchandise exports and imports of selected economies, January 2017-February 2019
Year-on-year % change in current dollar values
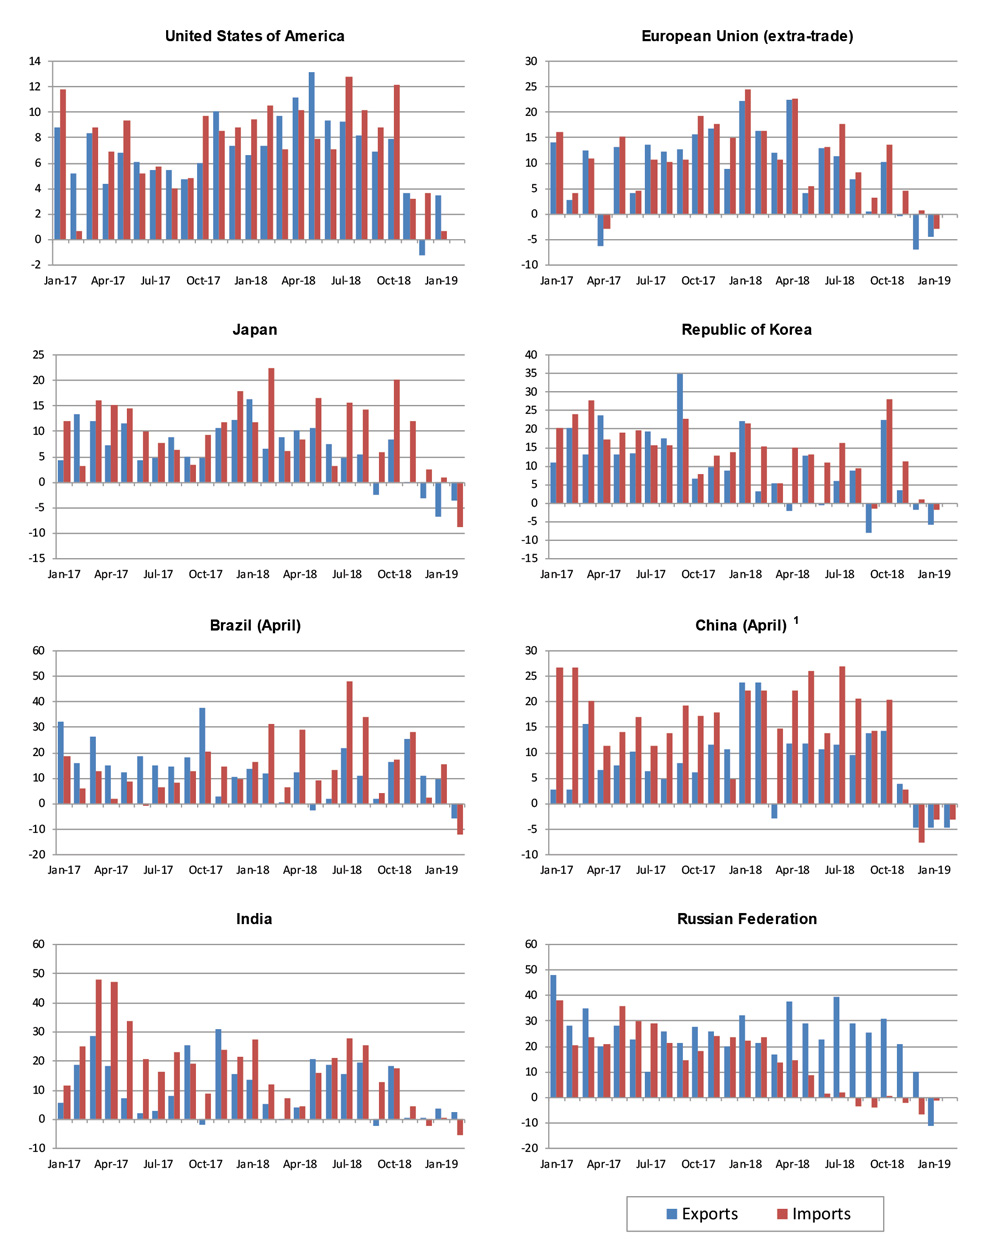 1 January and February averaged to minimize distortions due to lunar new year.
Source: WTO Short-term trade statistics.
Appendix Chart 2: Contributions to GDP growth of selected economies, 2012-2018
% changes and percentage points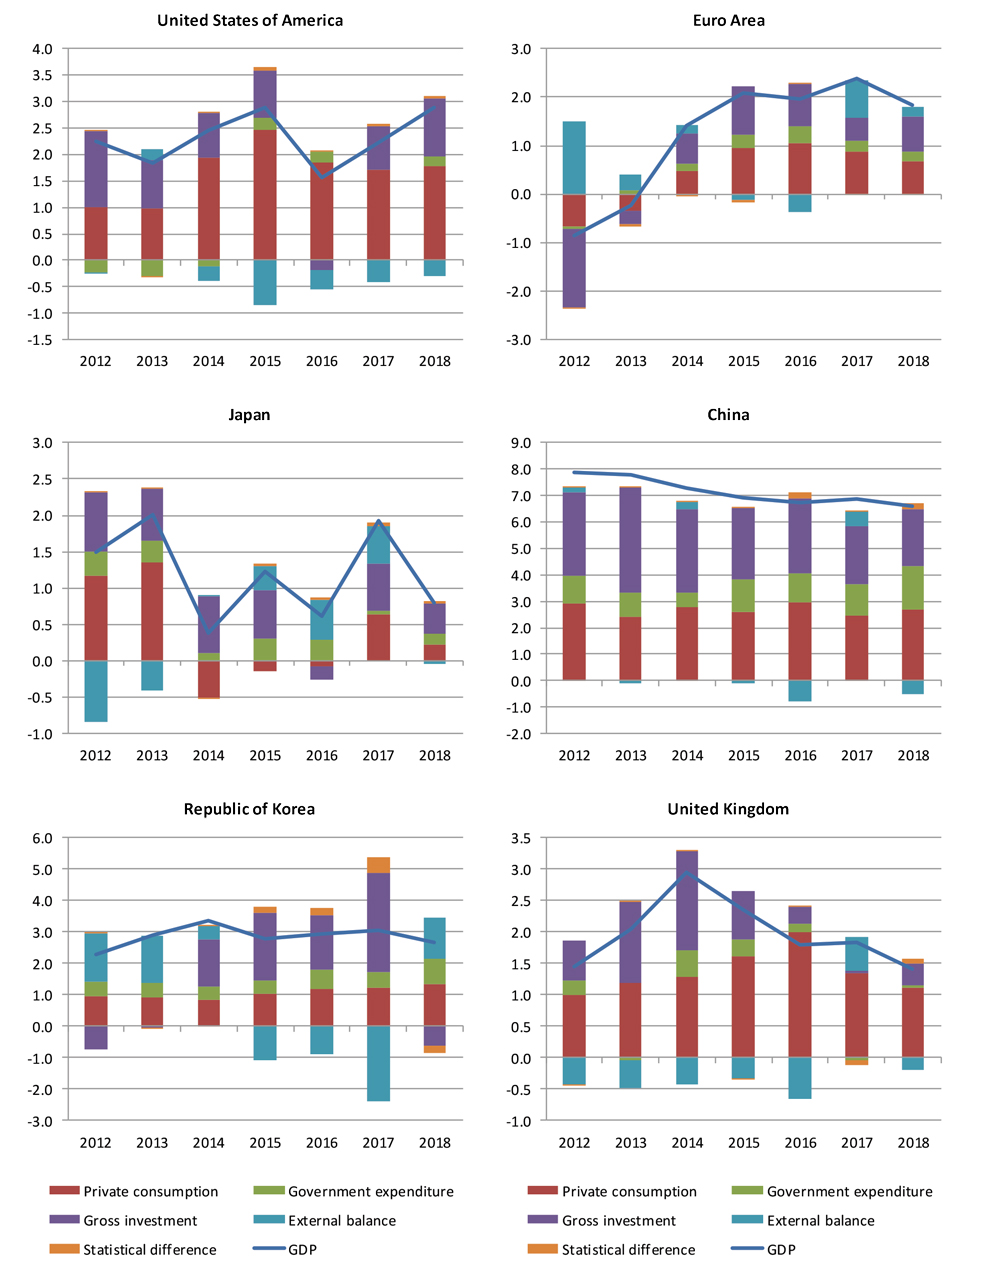
Source: OECD Quarterly National Accounts for all countries except China, which was sourced from UN National Accounts Statistics through 2017 and the Economist Intelligence Unit for 2018.